Precise Visualisation of the Global Production of EU Critical Raw Materials
The Geological Survey of Finland (GTK) has published a new visualisation illustrating global production volumes of the Critical Raw Materials (CRM) identified by the EU. A series of three world maps present the production of around 30 CRMs by country, with pie charts scaled precisely to reflect actual volumes. This approach responds to a central challenge in communicating CRM data: the enormous variation in production volumes among different CRMs.
The European Union has identified 34 Critical Raw Materials that are considered both economically important and vulnerable to supply disruption. Due to data availability constraints, 31 commodities or commodity groups are represented in the new visualisation. It displays a five year production average covering the period from 2019 to 2023, with data primarily derived from World Mining Data and supplemented by information from the U.S. Geological Survey. Where both mine and refined production statistics existed, mine production data was prioritised.
The three stage maps use a design that captures the enormous range of values
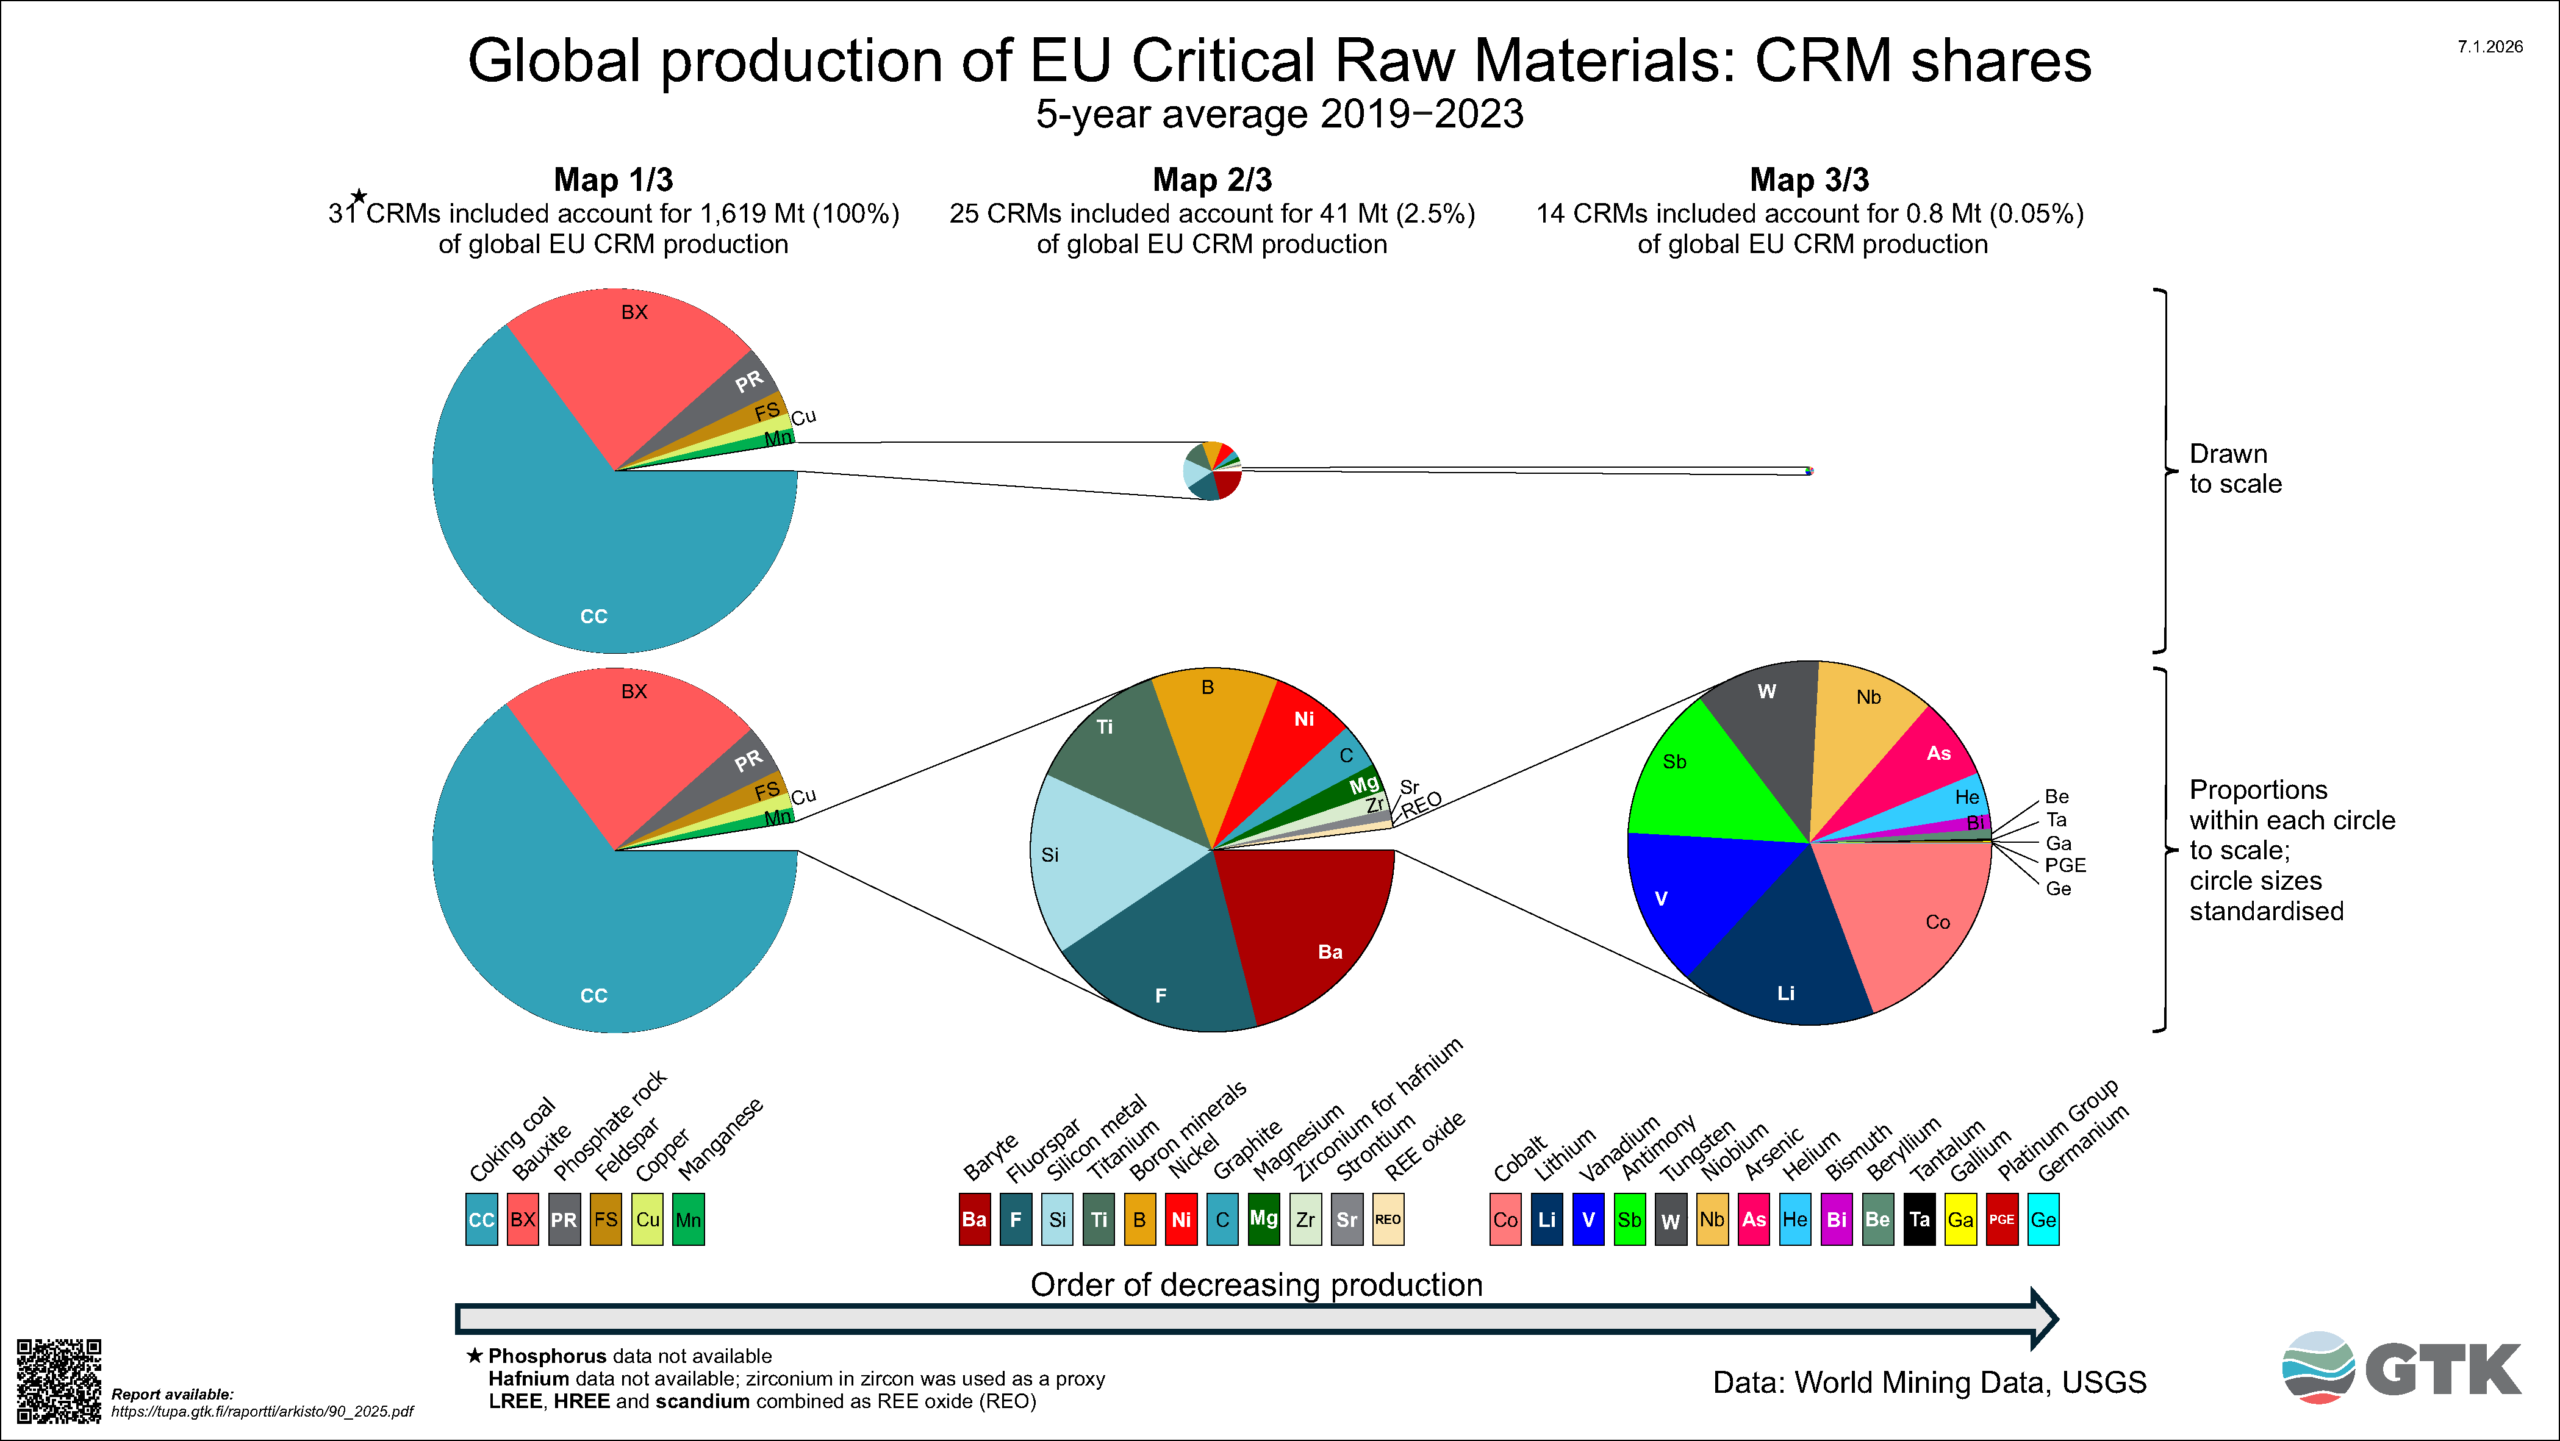
The global annual average production volumes of CRMs vary widely—from more than one billion tonnes (coking coal) to just over one hundred tonnes (germanium). This creates a challenge when the aim is to visualise production volumes with accurate tonnage proportions. The six most produced CRMs alone (coking coal, bauxite, phosphate rock, feldspar, copper and manganese) account for 97.5% of the global annual CRM production of 1,619 million tonnes.
To address this challenge, the CRMs were divided into three groups based on their global production.
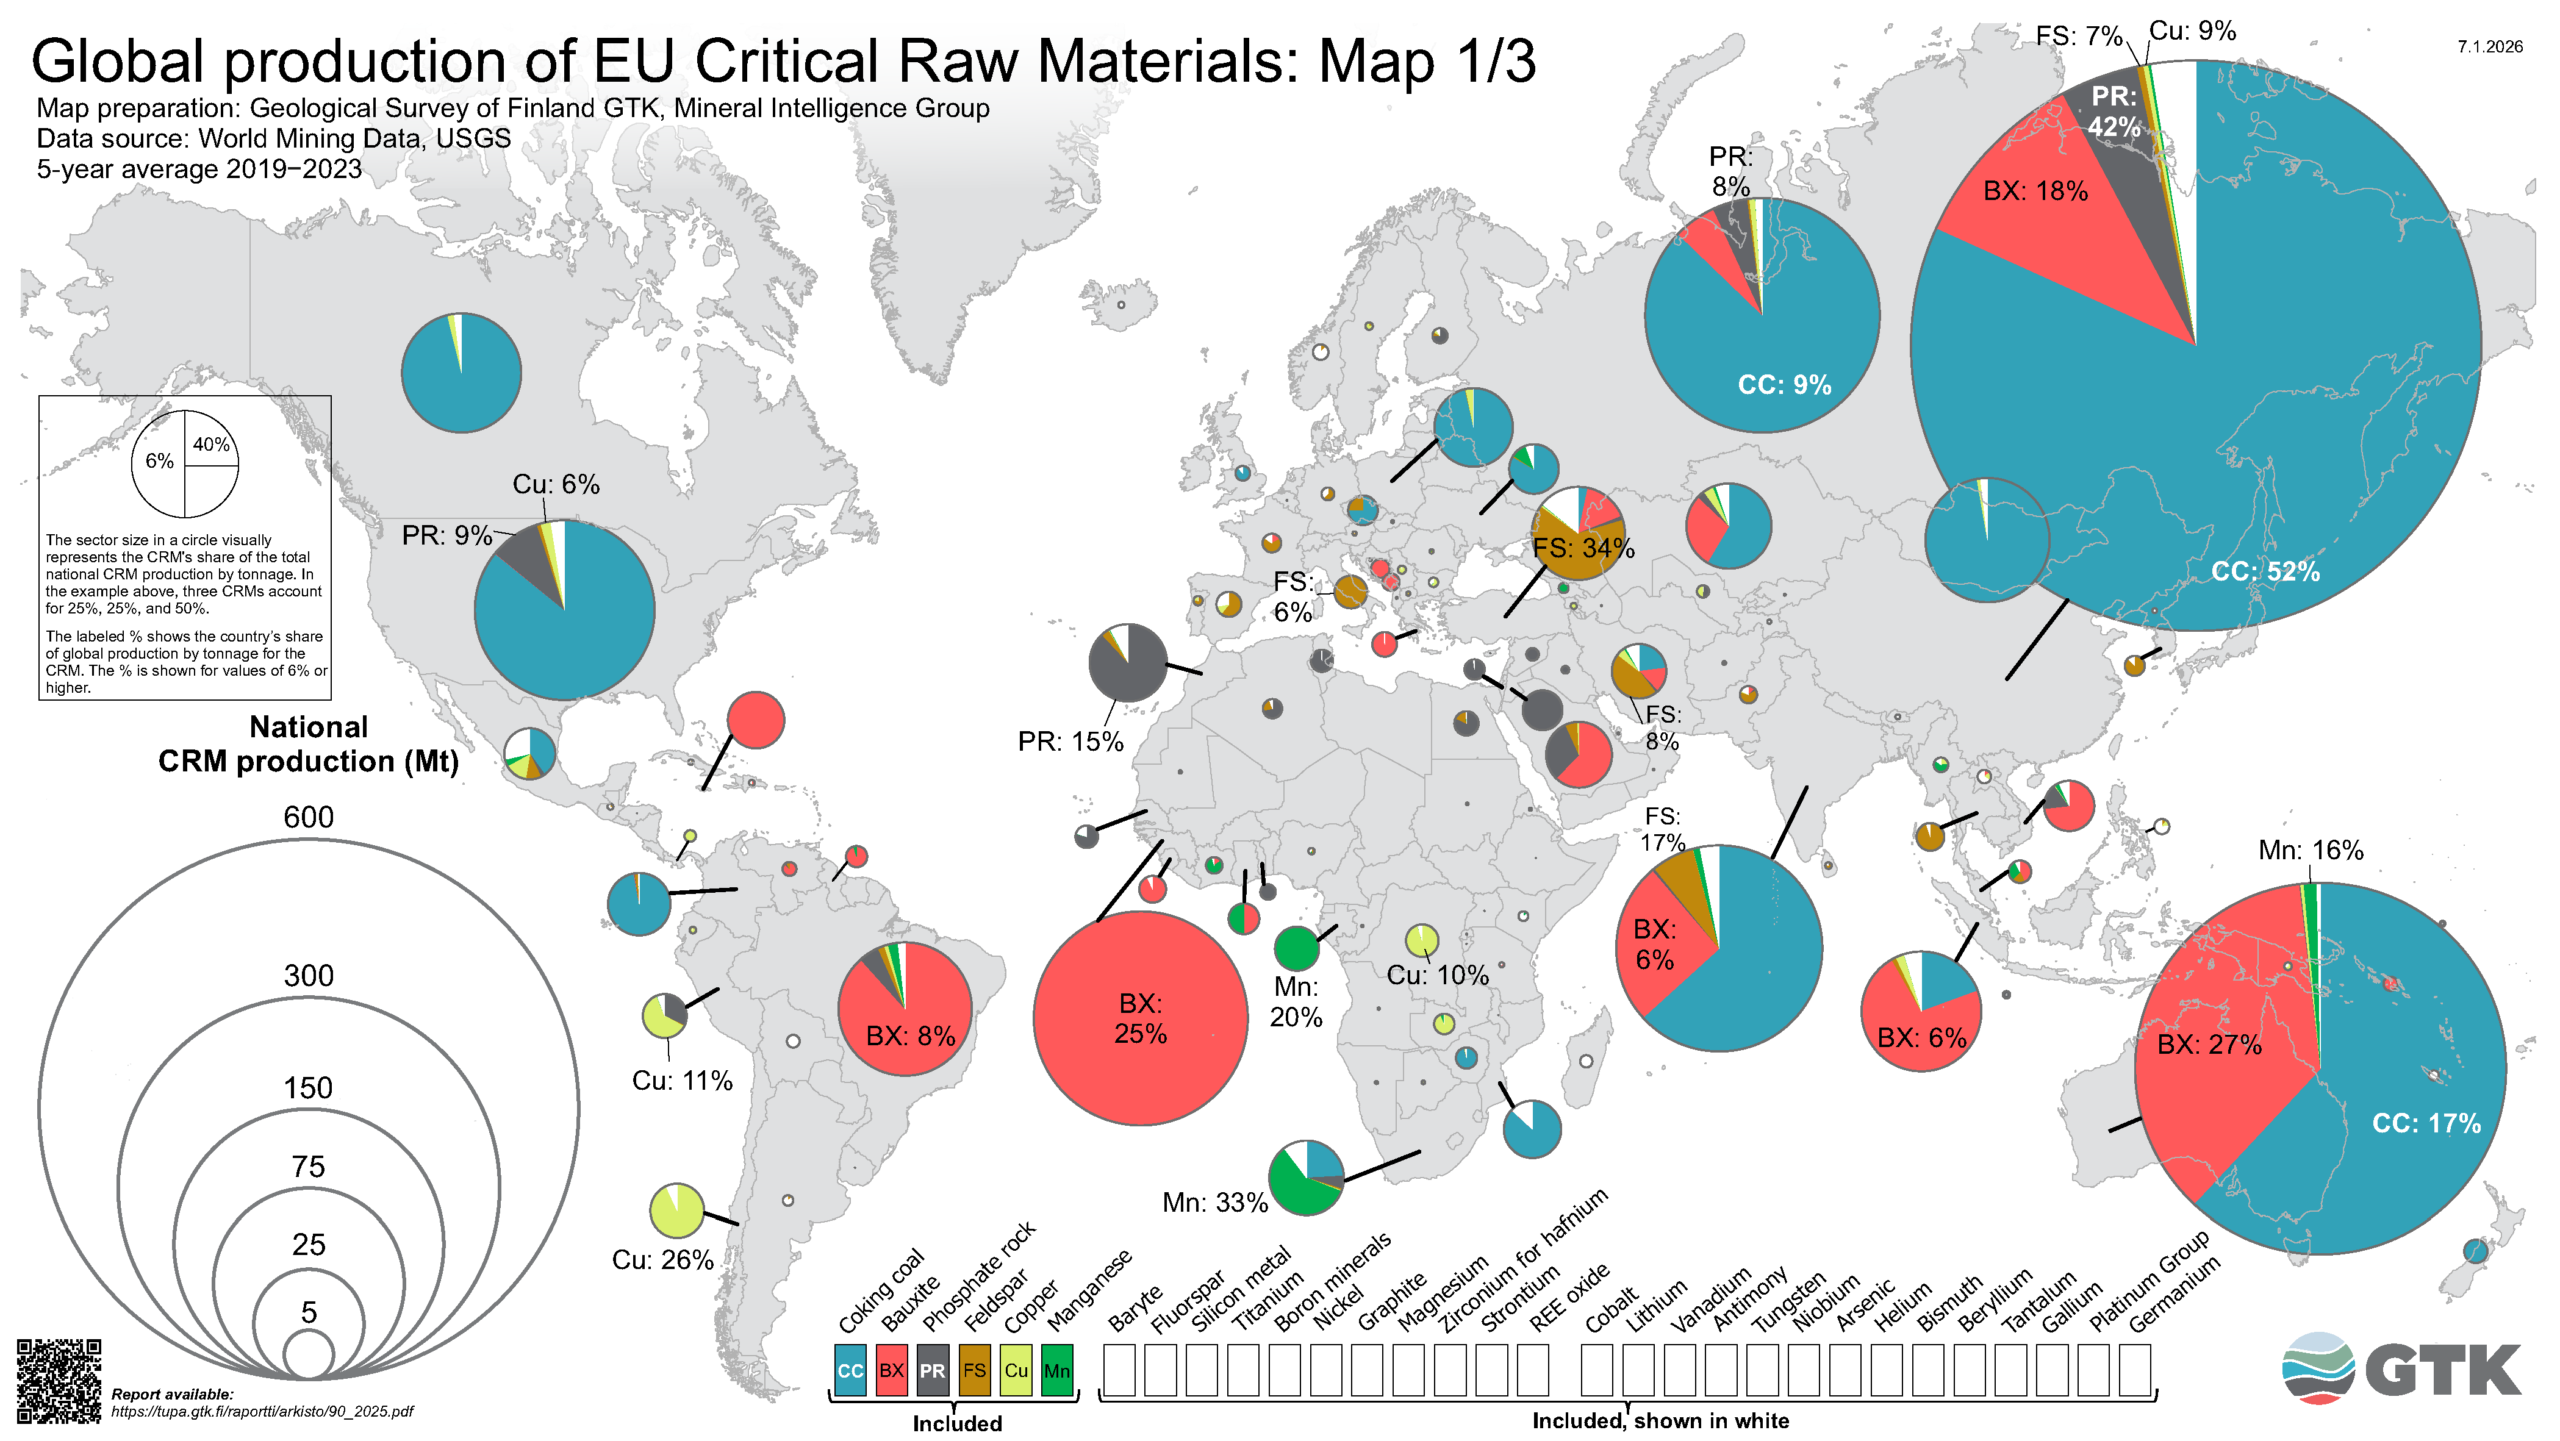
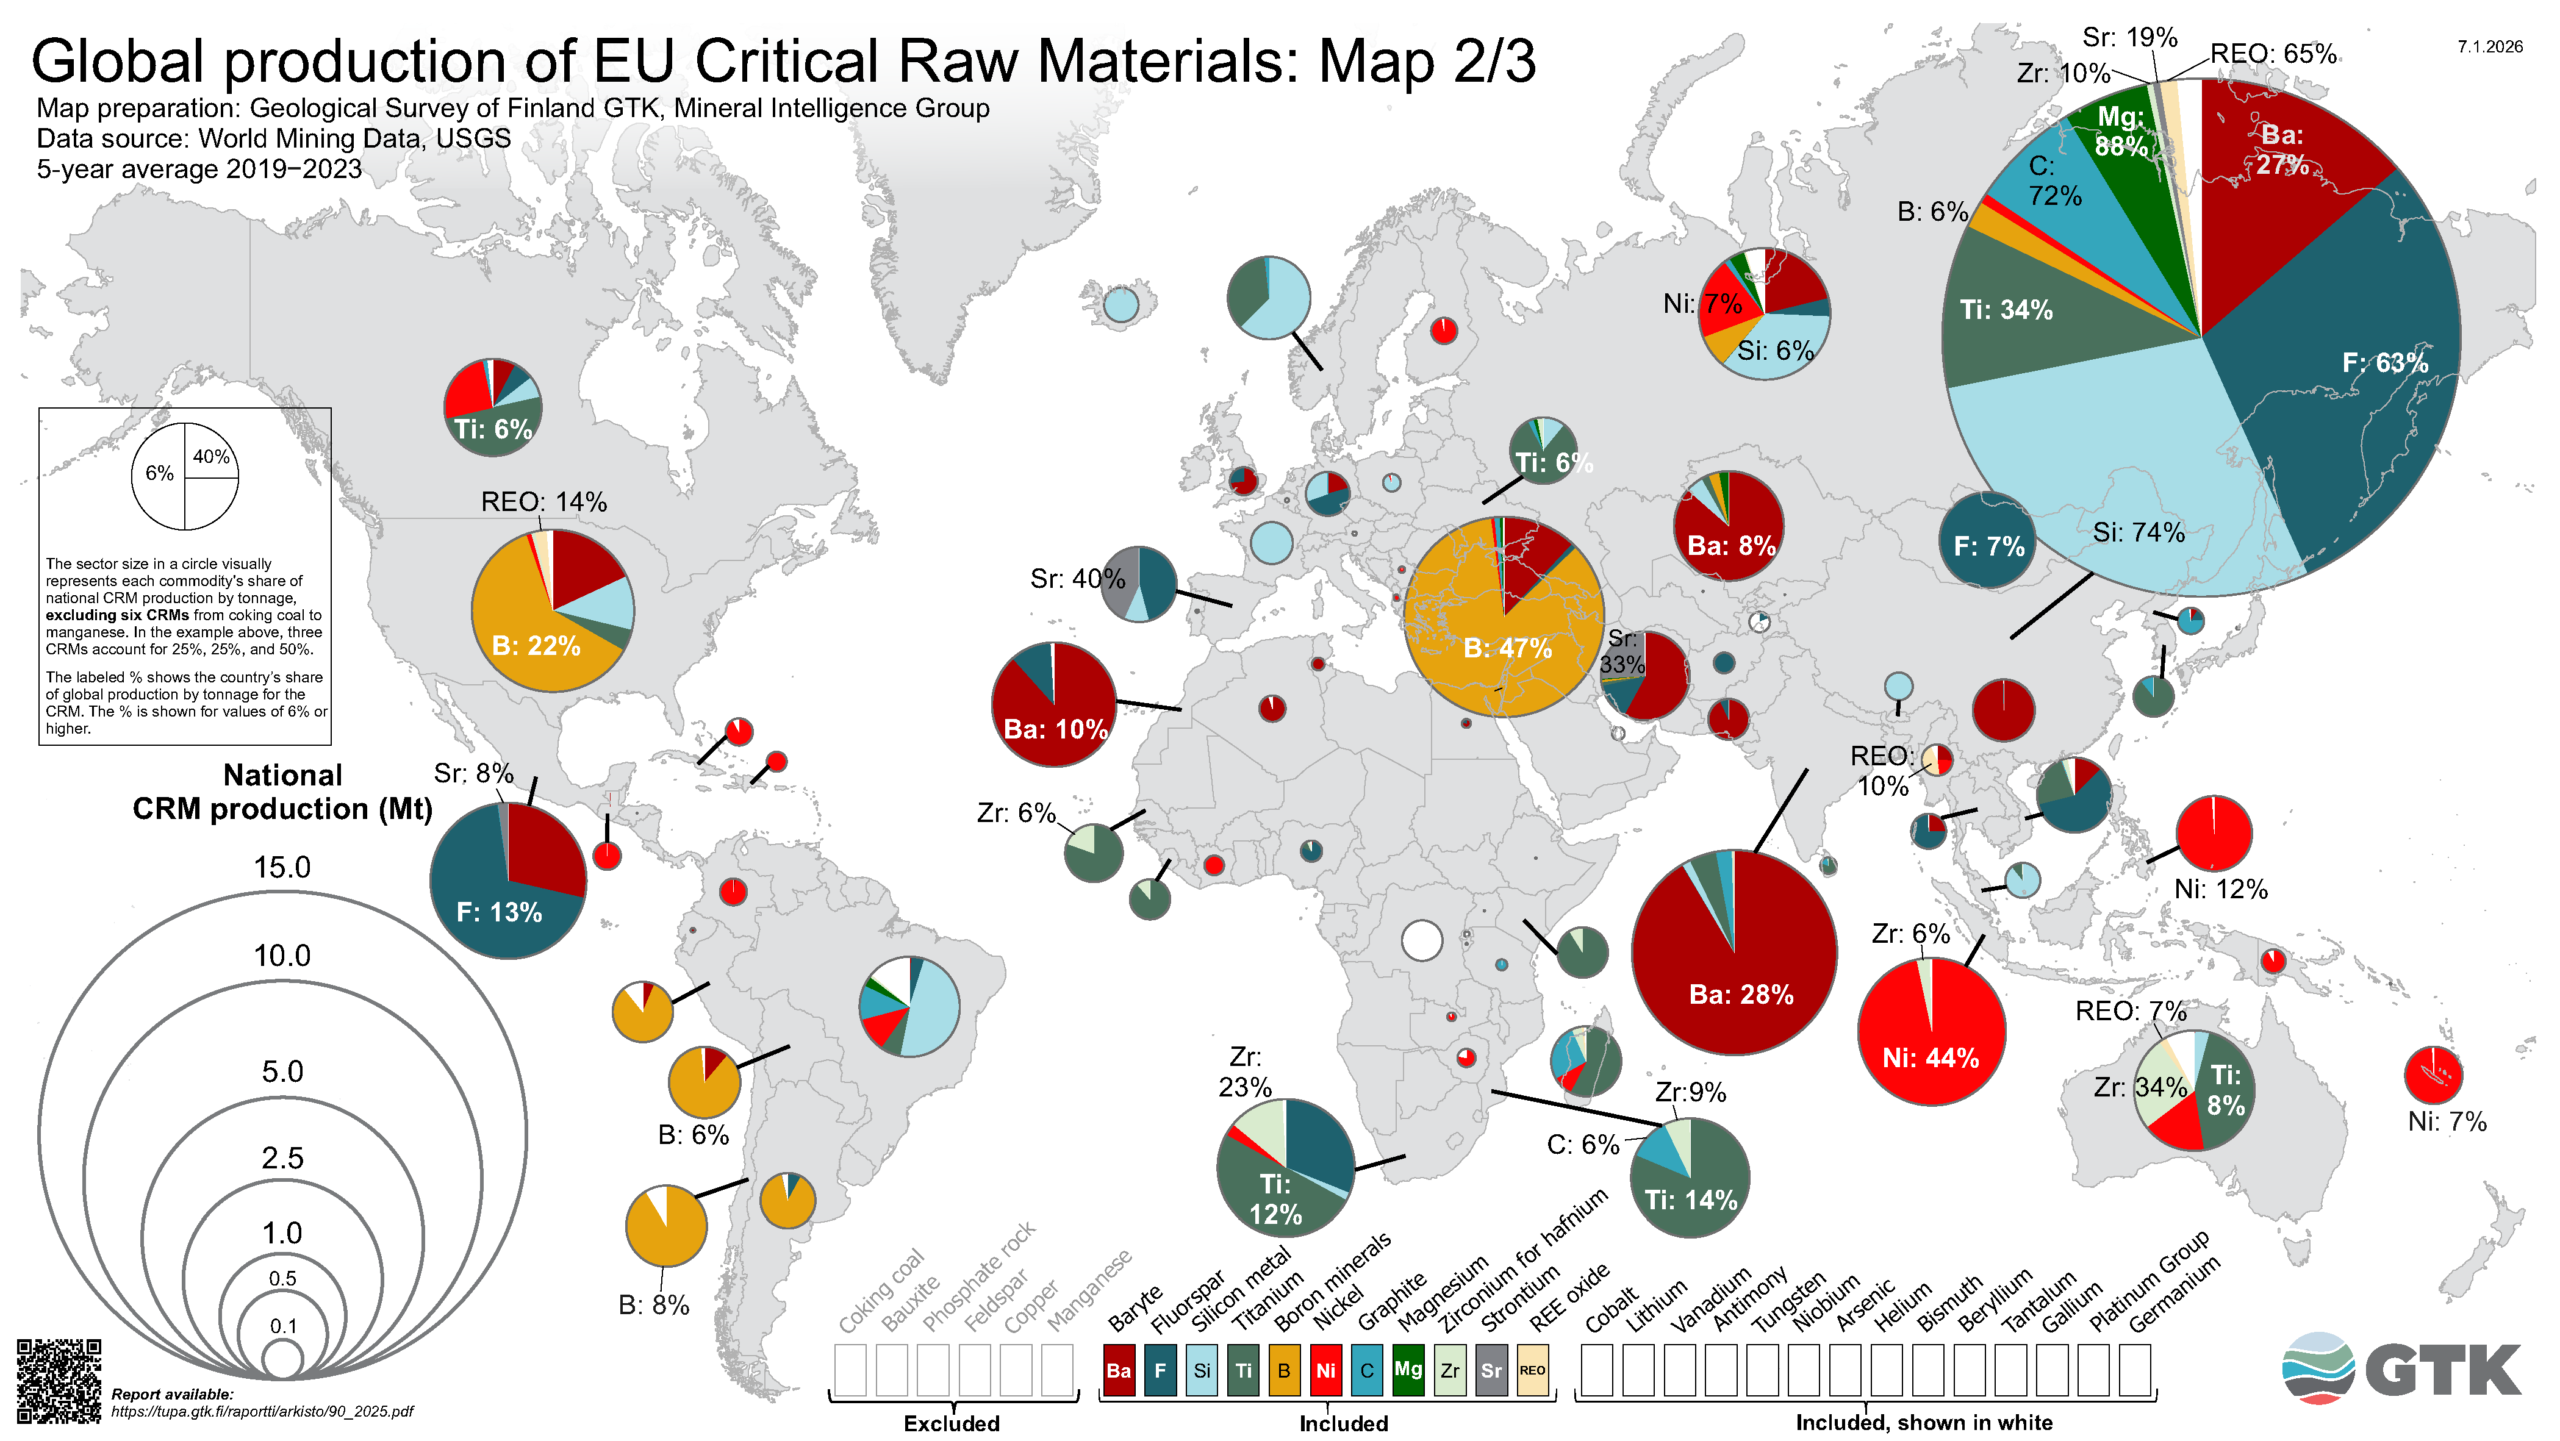
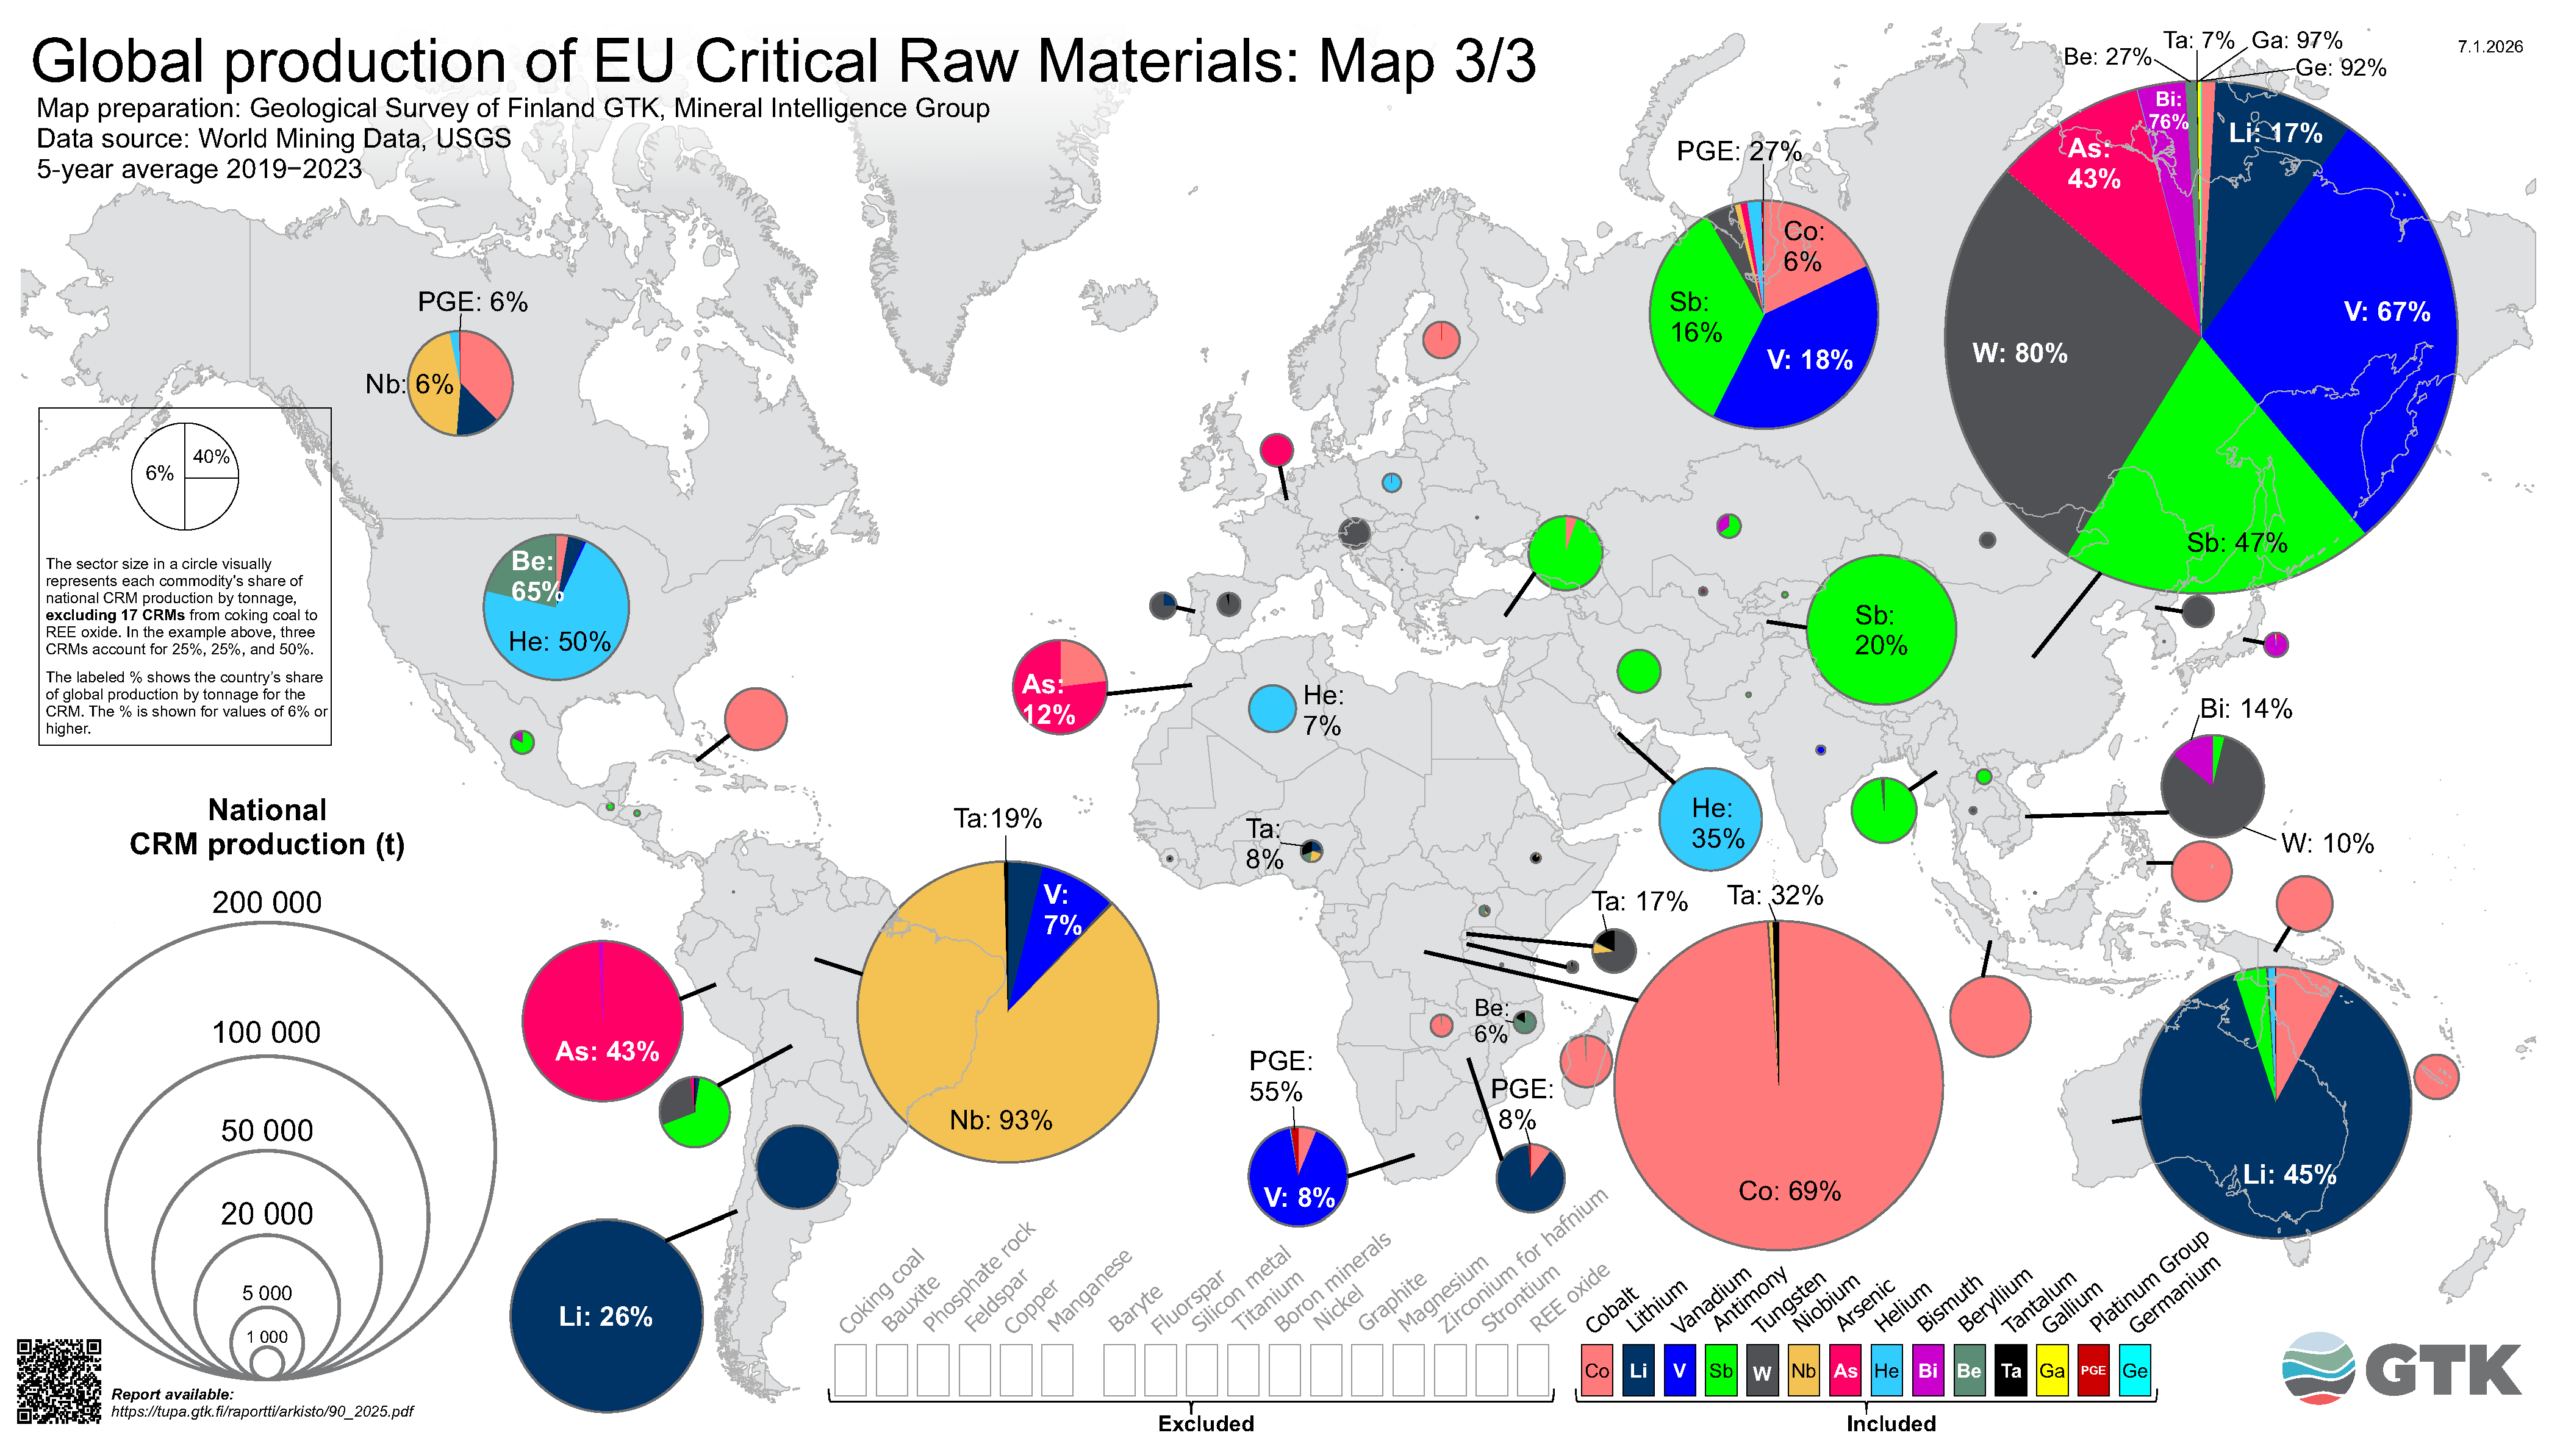
The first map focuses on the six highest produced CRMs, the second on 11 CRMs with intermediate production, and the third on the 14 CRMs produced in the smallest volumes. In the different maps, circles of the same size represent different tonnage levels as indicated in the legends—the largest in the first map and the smallest in the third.
In addition, the visualisation has been refined so that in the first map, the combined production volume of the other 25 less produced raw materials is shown as a single white sector in each country’s pie chart.
It is not possible to display these raw materials as separate sectors at this scale, because the sectors would be too narrow. Similarly, in the second map, the combined production volume of the other 14 less produced raw materials is shown as a single white sector in each country’s pie chart.
Proportionality of circle and sector sizes allow direct visual comparison
In each map, the circle size indicates the total production of the CRMs marked as ‘included’ in the legend, in the respective country. This allows the total production volumes of different countries to be compared within the same map (but not between different maps).
The sizes (area) of the sectors within the circles also directly correspond to the tonnages. This enables comparison of production volumes of different CRMs both within a country and between countries — again, only within the same map.
Due to this proportional scaling, the combined area of the sectors for a given CRM always represents 100% across all producing countries. A country’s share of the production of that CRM is shown as a percentage label when it is at least 6%. For example, a 52% label on coking coal’s sector in China’s circle indicates that China accounted for 52% of global coking coal production.
China is the world’s leading producer of 14 CRMs
The first map shows that China is the largest global producer of CRMs by total tonnage, followed by Australia, Russia, Guinea, India and the United States. This high total output is largely driven by substantial production of coking coal and/or bauxite in these countries. For China, even more significant than the highest total volume is that it is the world’s top producer of 14 different CRMs, making it the dominant supplier across all three maps.
The European Union contributes only a small share of global CRM production
Total CRM production within the European Union represents only 1% of total global output. Only two materials produced in EU member states exceed the six percent global share threshold: strontium from Spain and feldspar from Italy. Spain stands out as the only EU country that is the world’s leading producer of any CRM, contributing 40% of global strontium production.
Finland plays a prominent role in CRM production within the EU
Finland is a significant producer of CRMs within the EU. Approximately three quarters of Finland’s total CRM output consists of phosphate rock, explaining its visibility in the first map. In the second map, Finland stands out for its nickel production, and in the third for its cobalt output. Finland is the EU’s largest producer of phosphate rock, nickel and cobalt. It is also the largest EU producer of platinum group elements, although their small production tonnage means they appear only as very narrow sectors in the third map. Globally, platinum group elements are the second least produced CRM, ahead of germanium.
More information
Contact: Hannu Lahtinen