Science Blog: Developments in map data management and geological unit nomenclature in Finland
The digital management of geological interpreted data (maps and models) calls for consistent classification systems and vocabularies. The latest volume of the Bulletin of the Geological Survey of Finland summarizes the recent developments in the management of geological units and map data in Finland. The articles describe the structure of the new GTK Map Data Architecture, two new bedrock classification systems (tectonic-scale map units and tectonostratigraphic units) and a system for the classification and management of superficial (Quaternary) map units.
‘Regional geology’ is mostly understood as synonymous to ‘geological mapping’. Regarding the process, this is correct: the final output is typically a geological map – a combination of spatial features and their attributes. However, regional geology is much more. Regional geology covers the knowledge of geological units in different scales, their relationships and, most importantly, deeper understanding of the processes behind the lithology and geometry of the units.
The relevance of traditional geological mapping has been under pressure, and the relevance of printed map has been questioned. However, two more deep-seated but contradictory trends can be found behind the cross-fire: (1) the technological change with digitalization and transition from 2D models (geological map) to 3D modelling and (2) new use cases, such as global data portals, and new application areas of geological research (e.g. geoenergy, engineering, land-use planning). The first trend calls for consistency (data models, vocabularies) and classification hierarchies, whereas the second trend creates new terminologies and novel applied uses for the geological map data. In nutshell: how to be fully systematic and very flexible at the same time?
As a response, GTK has launched construction of a new map data architecture, which can be considered as a one key element of the broader National Geological Framework in Finland (NGFF). The modern architecture allows different approaches (e.g. tectonic, stratigraphic, structural) via a theme-layer-based structure. As a result, the geological features can be stored in all the richness according the best principles of the thematic discipline (e.g. structural geology). The combined use of the map themes enables a complete view of all aspects of the up-to-date regional geology.
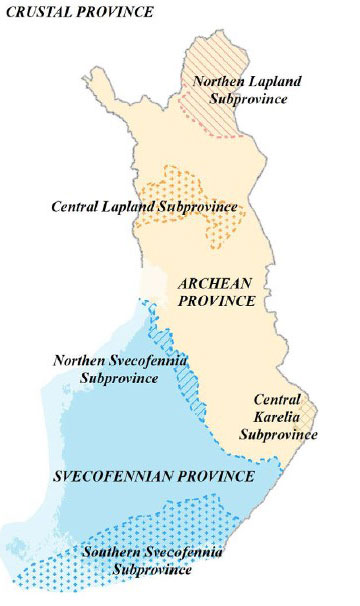
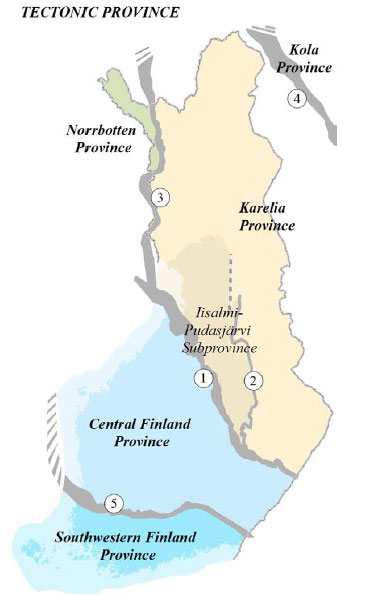
Regional geology typically builds up from large to small. All map units are part of a larger unit, and the conceptual framework is inherited downstream in the hierarchy. The latest volume of the Geological Survey of Finland Bulletin introduces the reader to the principles of the new map data architecture. Furthermore, the volume introduces three new classification systems for the country-wide geological map units: bedrock provinces, thrust-bounded (tectonostratigraphic) bedrock units and, finally, glacial dynamic provinces as the highest rank of the superficial (Quaternary) map units.
More background information can be found in the preface of the bulletin. The Geological Survey of Finland Bulletin with the original articles: https://doi.org/10.30440/bt412
ARTICLE # 1
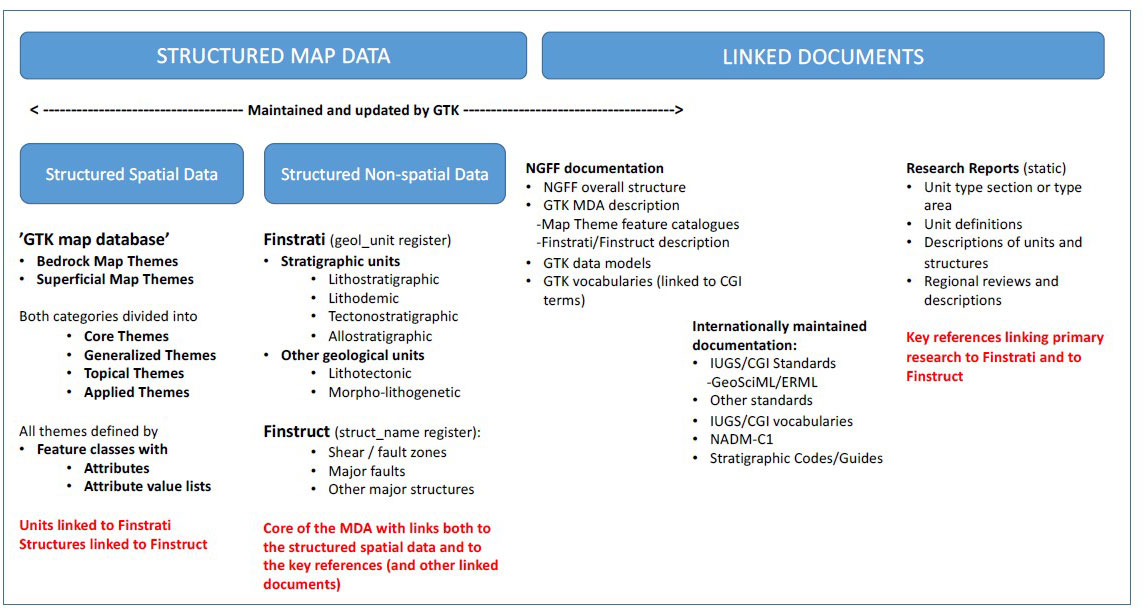
the primary research reports. The consistency of the system is supported by NGFF documentation and international
standards. The structure allows extensions from 2D map themes to 3D models without any major modification.
ARTICLE # 2
ARTICLE # 3
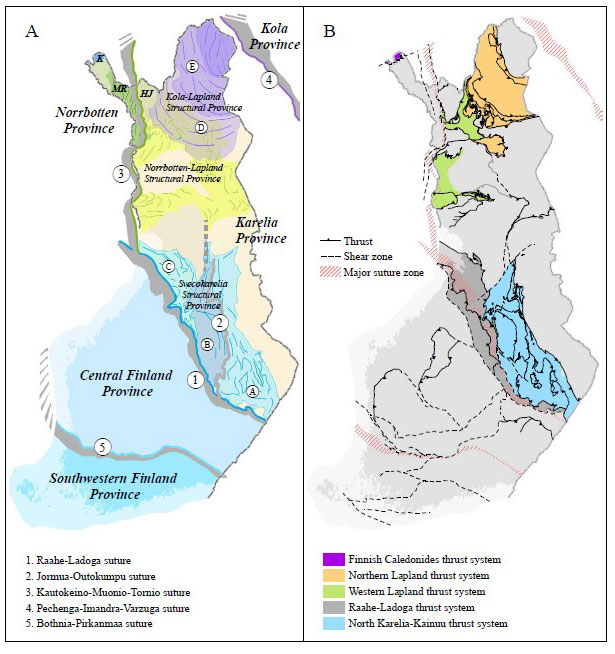
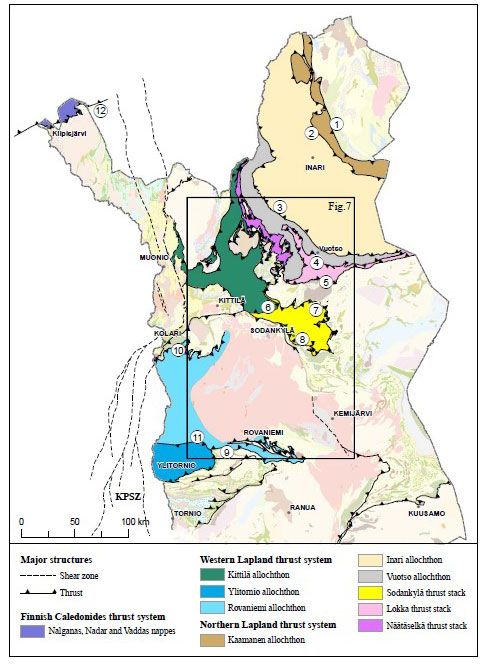
Fig. 3B. A simplified map of the thrust systems, major thrusts and prominent shear zones. Tectonic province boundaries (major suture zones) are also shown for comparison with 3A.
ARTICLE # 4
Text: Jarmo Kohonen
Jarmo Kohonen (PhD., dos. Bedrock Geology) is a Senior Scientist in the Information Solutions Unit in Espoo, GTK. His scientific background is in basin modelling, structural geology and geological mapping. Lately his main interest has been the conceptual modelling of geological information and modern stratigraphy.